
When the Ramp Is in the Wrong Place: Why Accessible Design Fails After the Blueprint Is Approved
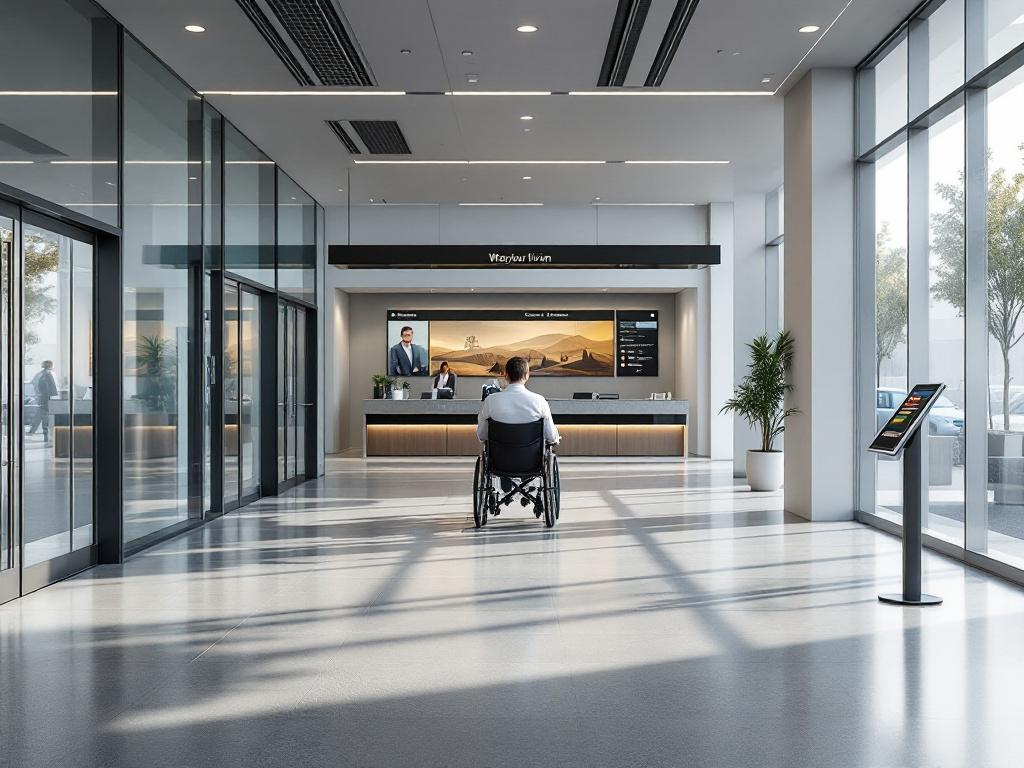
A new transit station opens downtown. It meets every line of ADA Title III code on paper — 36-inch doorways, compliant ramp slopes, marked accessible parking. Then a wheelchair user arrives and discovers the accessible entrance is around the back of the building. A parent with a stroller cannot navigate around a structural column placed mid-corridor. A low-vision visitor cannot locate the elevator call button against a glare-washed wall at 2 p.m. on a south-facing afternoon. The building is compliant. It is not usable.
This is the gap inclusive design is meant to close, and the gap that 2D blueprints consistently miss. Compliance and usability are not the same thing. Code certifies that a space cannot be sued. It does not certify that a person can move through it, find what they need, and leave without negotiating a series of small humiliations.
The gateway question for any owner, architect, or facility manager: how do you verify a space works for everyone before construction locks decisions in for the next thirty years? This article walks through how 3D scanning — the same spatial-capture technology now used in product development and STEM classrooms — has become the most reliable way to test accessibility in the design phase, and gives you a deployable checklist by the end.
Compliance keeps you out of court. Usability keeps people in the space.
Table of Contents
- Why Code-Compliant Spaces Still Fail Real Users
- How a 3D Scan Captures What a Floor Plan Cannot
- Five Barriers a 3D Scan Catches That a Floor Plan Hides
- Turning a Digital Twin Into a Design Decision
- Where 3D Accessibility Scanning Is Being Applied Today
- A Deployable Checklist for Commissioning a 3D Accessibility Audit
Why Code-Compliant Spaces Still Fail Real Users
The gap between regulatory compliance and lived accessibility is not a failure of intention. It is a failure of representation. Building codes describe a space at the level of measurable thresholds — door widths, ramp ratios, stall depths — and a 2D floor plan represents the building as a top-down schematic at a single horizontal slice, typically four feet above finish floor. That representation makes it possible to verify code. It does not make it possible to verify experience.
Three categories of barrier sit in this gap, and each one is invisible to a traditional 2D audit.
Spatial barriers show up where geometry stops being measured in isolation. A 36-inch doorway is compliant on its own. The relevant question is whether a wheelchair user can complete the approach, pull, and pass-through sequence required by ADA Title III maneuvering-clearance requirements when a reception counter sits 42 inches in front of the door, or when a fire extinguisher cabinet protrudes into the swing path. 2D plans almost never model the furniture-in-place condition. They show the door alone, not the door surrounded by the rest of the room.
Sensory barriers show up where the building meets light, sound, and material in ways a plan cannot draw. Stair nosings can meet contrast specifications on a sample card and disappear under afternoon glare. Open-plan lobbies can sound spacious in renderings and prove acoustically hostile to anyone wearing a hearing aid. The MapIt research published in PMC notes that occupational therapists value 3D scanning specifically because it gives them a "global view and better understanding of the patient's environment" — measurement without spatial context misses the dynamics that determine whether a space actually works (PMC/NIH).
Cognitive barriers show up where wayfinding decisions stack. Signage hierarchy, decision-point density, the visual noise of competing information — these shape whether a visitor with a cognitive disability, a non-native reader, or simply someone in a hurry can find the elevator on the first try. The University of Washington's Makeability Lab built its DIAM system (Drone-based Indoor Accessibility Mapping) precisely because identifying where a wheelchair-accessible restroom or elevator sits, in spatial context, is non-trivial from plans alone — the system uses 3D reconstructions to recognize and locate accessibility facilities automatically (Makeability Lab).
A floor plan cannot answer any of these questions. Accessibility happens at multiple eye levels — roughly 43–51 inches for a seated wheelchair user, 60–69 inches for a standing adult, around 36 inches for a child — and is shaped by depth, vertical surfaces, lighting vectors, and acoustic reflection. A top-down slice flattens all of that into nothing.
The cost asymmetry between catching a barrier in design versus catching it after occupancy is the practical reason this matters. Fixing an accessibility failure during digital iteration costs hours of staff time. Fixing the same failure after the ribbon-cutting means demolition, redesign, contractor remobilization, and — most importantly — weeks or months during which the people the building was supposed to serve cannot use it. The MapIt paper explicitly identifies the absence of "convenient and consumer-available technology to map the home environment in 3D and explore adaptations" as an unresolved problem in occupational therapy practice. The same gap exists at building scale.
This is where inclusive design stops being a philosophy and starts being a workflow question: what tool can show you the building as people will actually move through it, before the contracts are signed?
How a 3D Scan Captures What a Floor Plan Cannot
The workflow for using 3D scanning as an accessibility instrument breaks into five sequential steps. A facility manager should be able to explain this to a contractor in a single meeting.
1. Capture the space. Three dominant capture methods cover most projects. LiDAR uses laser ranging and now ships in iPhone Pro and iPad Pro devices alongside stationary tripod scanners. Photogrammetry stitches overlapping images into geometry — the workflow used by smartphone apps like Hover. Structured light projects a known pattern and reads its deformation, the technique used in handheld units like Artec scanners. According to Fine Homebuilding's independent review, Hover smartphone scans matched manual tape measurements with only minor omissions requiring correction, at $90 per scan. The MapIt mobile workflow scans a typical room in under 5 minutes (PMC/NIH).
2. Build the digital twin. Raw point cloud or mesh data is processed — Hover's cloud processing takes roughly 4 hours per scan — into a navigable 3D model with measurable surfaces, dimensional fidelity, and, depending on capture method, texture and material reflectivity data. This is the same digital-twin workflow used to accelerate product development, applied to architectural space instead of consumer hardware.
3. Layer accessibility criteria. Reach zones, 60-inch wheelchair turning circles, slope grades, and sightline cones are overlaid against the 3D geometry inside design software — Revit, ArchiCAD, or specialized accessibility plugins. This is not manual annotation. It is parametric overlay, which means the criteria update automatically when the geometry changes.
4. Simulate user paths. Virtual walkthroughs run from multiple eye heights and mobility profiles. A designer can place a camera at 47 inches and walk the route a wheelchair user would take. The DIAM research demonstrates a more automated form of this — the system recognizes accessibility facilities directly from 3D reconstructions, so path-readability analysis can run without manual tagging (Makeability Lab).
5. Identify friction before lock-in. Conflicts surface in the digital model. They are resolved in design before contracts are signed. The cost of a digital revision is staff hours. The cost of a built revision is contractor remobilization and occupancy delay.

The choice of method depends on the decision the scan must support.
| Method | Capture Speed | Verified Accuracy | Equipment / Cost | Best Use for Accessibility |
|---|---|---|---|---|
| Smartphone photogrammetry (Hover) | ~15 min field + 4 hr cloud | Matched manual tape with minor omissions | $90 per scan | Rapid pre-design audits, residential adaptations |
| Smartphone LiDAR (MapIt) | <5 min per room | Not formally specified in source | App-based, low cost | Home modification, OT assessments |
| Stationary LiDAR (Matterport Pro3) | 20–60 min per floor | Manufacturer-grade | $6,595 device | Commercial buildings, compliance work |
| 360° camera (Ricoh Theta Z1) | Fast capture, lower geometric precision | Image-dependent | $1,170 device | Visual context, stakeholder review |
| Drone-based (DIAM, research) | Faster for large spaces | "Precise, detailed 3D reconstructions" | Research system | Public buildings, facility recognition |
Sources: Fine Homebuilding; PMC/NIH; Makeability Lab
For early-stage design iteration, smartphone-based capture is often sufficient — the question at that stage is whether a wall is in roughly the right place, not whether it sits within a millimeter of spec. For compliance verification and contractor accountability, higher-precision stationary scanning is warranted because the measurement becomes the evidentiary record. 360° cameras serve a different purpose: they capture visual context for stakeholder review meetings rather than precise geometry for design work. One honest caveat — independent accuracy benchmarks specifically for accessibility-critical measurements (slope variance, clearance verification, reach-range validation) are not yet standardized across the industry. Practitioners should ask vendors to demonstrate accuracy on the specific measurements that drive their decisions, not on aggregate room-dimension claims.
Five Barriers a 3D Scan Catches That a Floor Plan Hides
The gap between 2D and 3D representation is abstract until you can name the specific barriers each one misses. These five categories cover most of the failures that turn up in post-occupancy accessibility audits.
- Sightline obstruction at seated eye height. A column, a low-hanging sign, a ceiling-mounted display — any of these can sit entirely above a 2D plan's reference line yet block the view from a wheelchair user's seated eye level (roughly 43–51 inches). 3D scans let you place a virtual camera at that height and verify whether wayfinding signage, exit indicators, and reception desks are actually visible from the position a user occupies. The DIAM research at the University of Washington focused specifically on automated recognition of accessibility facilities in 3D reconstructions for this reason — the spatial context determines whether a feature is findable, not just whether it exists (Makeability Lab).
- Compound slope and transition stacking. A ramp may meet the applicable slope ratio in isolation, but when it meets an existing floor with a 1° cross-slope and a quarter-inch threshold transition, the cumulative grade can exceed the limits a wheelchair or walker can safely negotiate. 3D capture preserves all surfaces as measurable geometry rather than abstracted lines, which exposes the stacked condition. A 2D plan shows the ramp. A 3D scan shows the ramp, the threshold, the floor cross-slope, and the cumulative condition the user actually rolls over.
- Maneuvering clearance under realistic conditions. A 36-inch doorway is compliant in isolation. The relevant question is whether a wheelchair user can complete the approach-pull-pass sequence given furniture placement, adjacent walls, and circulation flow. A 3D model with furniture loaded shows the actual maneuvering envelope; a 2D plan shows the door alone. The same logic applies to restroom stalls, kitchen workstations, and reception counters — every clearance is a function of what surrounds it.
- Lighting, glare, and contrast in context. Stair nosings, signage, and switch plates can meet contrast ratios on the spec sheet and disappear under real lighting — south-facing glare across a polished floor at 2 p.m., fluorescent washout against beige walls, mixed daylight and overhead fixtures producing color shift. 3D scans that capture material reflectivity, or are loaded into lighting-simulation tools, reveal these failures before fixtures are specified rather than after the building is occupied.
- Acoustic and sensory load in open plans. Open layouts that read as spacious in plans can be navigationally hostile for users with hearing aids (echo, masking) or sensory processing differences (visual noise, decision overload). 3D models loaded into acoustic-simulation tools surface dead zones and reflection problems. This remains an emerging practice — few off-the-shelf tools combine accessibility analysis and acoustic modeling cleanly, and practitioners working in this area frequently build custom workflows. The same spatial-capture techniques transforming STEM learning environments are starting to migrate into sensory-inclusive building design.

Turning a Digital Twin Into a Design Decision
Capturing barriers is the easy half of the workflow. Turning a digital twin into design decisions — and into a built space that performs differently as a result — is where most accessibility programs succeed or stall. Four threads matter here.
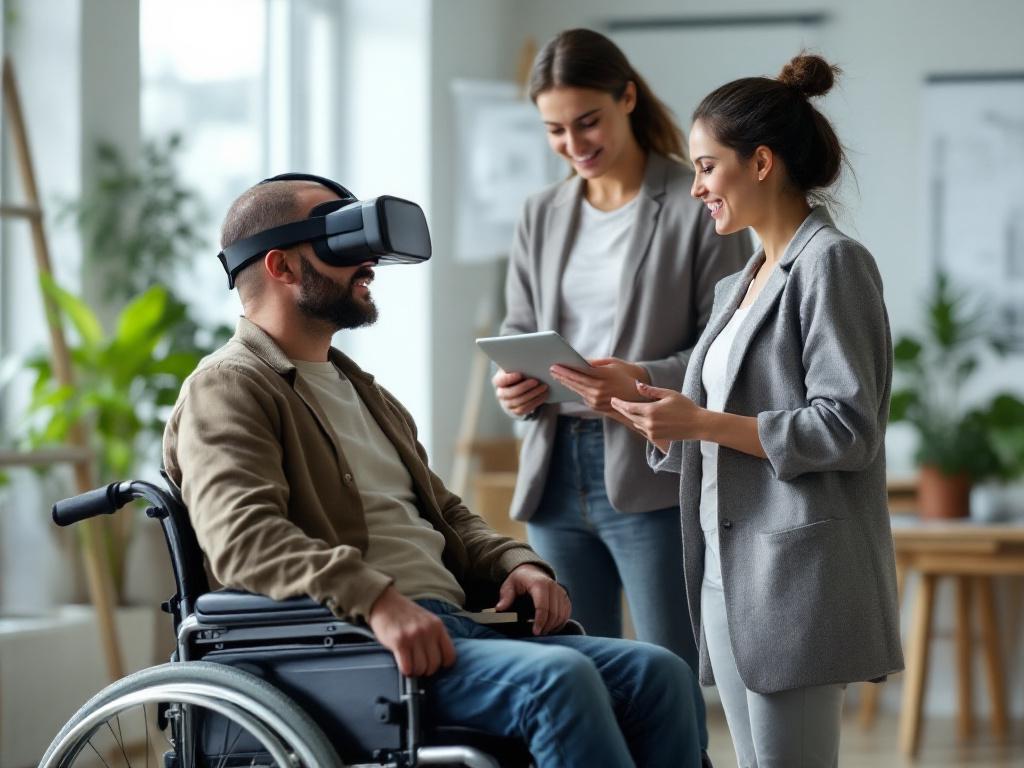
Immersive review from user perspectives. A digital twin loaded into VR is not a gimmick. It is a way to put a designer's eyes at wheelchair height, behind a low-vision filter, or inside a reach-range overlay. The MapIt research found that occupational therapists value 3D scanning specifically because it lets them "take measurements, facilitate recommendations, and give visual support to explain those recommendations" (PMC/NIH). The digital twin functions as a shared communication artifact, not just a measurement tool. When an architect, an owner, and a building user can each move through the same model from their own vantage point, the conversation changes — disagreements that used to be about interpretation become disagreements about evidence, which are easier to resolve.
Rapid iteration in digital space. Three to five design variations can be tested in hours rather than weeks. Move a column virtually. Widen a corridor virtually. Reposition signage virtually. Run the user-path simulations again. The cost of digital iteration is staff time. The cost of built iteration is demolition, redesign fees, contractor remobilization, and occupancy loss. The same iteration economics that drive waste reduction in textile manufacturing apply at building scale: catch the error in the digital model, and it never becomes physical waste.
A design iteration in virtual reality costs hours. The same iteration in a finished building costs months and a contractor remobilization fee.
Stakeholder alignment around shared evidence. Architects, developers, facility managers, and disability advocates often argue past each other when each party works from a different representation of the space — the architect from renderings, the developer from spreadsheets, the facility manager from O&M drawings, the advocate from lived experience and code. A shared digital twin collapses the dispute. Everyone is looking at the same geometry, the same sightlines, the same clearances. This matters most for co-design with disability advocates, who have historically been brought into projects after major decisions are locked rather than during the iteration phase when their input could change outcomes.
Co-design with users with disabilities — and the limits of simulation. A caveat that has to be stated directly: VR simulation of disability is not a substitute for the lived expertise of people with disabilities. A non-disabled designer wearing a low-vision filter for ten minutes is not having the same experience as a person who has navigated the world with low vision for thirty years. The MapIt paper notes plainly that "accessibility considerations must be addressed to support adoption" of the scanning tools themselves, because the technology is not yet fully accessible to its intended end users (PMC/NIH). The honest framing is that 3D scanning makes co-design more productive when people with disabilities are in the room — because the conversation is grounded in shared spatial evidence rather than verbal description — but it does not replace that conversation. Treating simulation as a substitute for participation is one of the failure modes the field has to actively guard against.
The financial logic underneath all four threads is consistent: every accessibility decision made in the digital phase is an order of magnitude cheaper than the same decision made after occupancy. The exact multiplier varies by project type, building scale, and contract structure, and is not yet well-documented in independent peer-reviewed research — an honest gap to acknowledge. The directional argument, though, is solid enough that any owner working on a multi-year capital project should be asking why the workflow isn't already standard.
Where 3D Accessibility Scanning Is Being Applied Today
Independent, peer-reviewed outcome data comparing 3D-scanned versus traditionally-audited accessible spaces is limited — a gap the research community is still filling. The application contexts themselves, however, are well-documented across five distinct settings.
| Application Context | What the Scan Captures | Documented Workflow | Source / Research Stage |
|---|---|---|---|
| Aging-in-place home modification | Room geometry, doorways, bathroom clearances, furniture-in-place | Smartphone scan (<5 min/room) reviewed by OT for adaptation | MapIt, peer-reviewed (PMC/NIH) |
| Public building accessibility mapping | Indoor geometry plus automated recognition of ramps, restrooms, elevators | Drone capture, automated facility recognition | DIAM, Makeability Lab (research) |
| Residential pre-renovation assessment | Full interior 3D plan with verified dimensional accuracy | Smartphone photogrammetry, ~15 min + 4 hr processing | Fine Homebuilding (independent review) |
| Commercial / facility compliance audit | High-precision LiDAR capture of full floors | Stationary scanner, professional processing | Vendor-documented; independent benchmarks limited |
| Historic building accessibility retrofit | Geometry of constrained, irregular existing conditions | Combined LiDAR + photogrammetry | Practice-documented; outcome research limited |
Sources: PMC/NIH; Makeability Lab; Fine Homebuilding
The pattern across contexts is informative. The strongest evidence base sits in home modification for aging-in-place and disability adaptation, where the MapIt peer-reviewed work positions 3D scanning as a way to extend occupational therapy reach beyond in-person home visits — particularly valuable in rural areas, during pandemic-era restrictions, or for clients whose homes are difficult to access for traditional assessment. The next-strongest evidence is in public building accessibility mapping, where the DIAM research demonstrates automated recognition of accessibility features at building scale, which is the kind of workflow that makes accessibility audits practical for portfolios of dozens or hundreds of buildings rather than one at a time.
Commercial compliance and historic retrofit applications are well-practiced but lack the same independent outcome research. Facility managers in those contexts should treat current vendor claims with appropriate scrutiny and ask for accuracy benchmarks specific to accessibility-critical measurements — clearance, slope, reach, contrast — rather than accepting aggregate room-dimension accuracy as a stand-in. The research field needs more comparative outcome studies. Does a 3D-scanned design actually produce more usable spaces than a conventionally audited one? The answer is currently probably yes, based on workflow logic and practitioner reports, but rigorous before-and-after evidence is still being built. Saying so plainly strengthens, rather than weakens, the case for adopting the technology now: the workflow advantage is real, the documentation work is ongoing, and practitioners who adopt early are also the ones who will produce the evidence that becomes industry standard.
The honest framing is this: 3D scanning makes co-design more productive. It does not replace the people whose lives the design is meant to fit.
A Deployable Checklist for Commissioning a 3D Accessibility Audit
What follows is a working template, not a recap. Three sub-checklists, fifteen items, organized by phase. Hand it to your team or your scanning vendor next week.
Phase 1: Before the scan
1. Define your user profiles. List the primary users with disabilities your space must serve — wheelchair users, users with low vision, users with hearing loss, users with cognitive or sensory processing differences, parents with strollers, older adults using walkers or canes. The scan workflow you choose depends on which barriers matter most for these users. A space serving primarily ambulatory low-vision users has different priority barriers than a space serving primarily wheelchair users, and the scan should be specified accordingly.
2. Identify the high-friction zones. Entries, transitions, restrooms, wayfinding decision points, vertical circulation, and emergency egress are where most barriers concentrate. Scan these in detail. Lower-traffic zones can be captured at lower density without weakening the analysis.
3. Set your accuracy tolerance. For pre-design iteration, smartphone-grade accuracy verified against manual measurement (per Fine Homebuilding's independent review) is typically sufficient. For compliance verification or contractor accountability, specify higher-precision LiDAR. Match the tolerance to the decision the data must support.
4. Choose the capture method against the trade-off. Smartphone capture is fast (<5 min per room per MapIt) and inexpensive. Stationary LiDAR is precise and slower. Drone-based capture suits large or complex public buildings. The wrong method is the one chosen by habit rather than by fit.
5. Establish your accessibility criteria baseline. Reference the applicable codes — ADA Title III, IBC accessibility chapters, ISO 21542 for international projects, plus local jurisdiction requirements — and the universal-design principles you want to exceed compliance on. Compliance is the floor of the room, not the ceiling. Document which criteria are mandatory and which are aspirational so the design team can prioritize honestly when trade-offs surface.
Phase 2: Working with the scan
6. Layer the accessibility overlays. Reach zones, turning circles, sightline cones, slope grades — load these against the digital twin so barriers are visible, not inferred. A barrier you have to interpret from raw geometry is a barrier you will miss under deadline pressure.
7. Simulate at least three user journeys. Wheelchair user from accessible parking to the destination room. Low-vision user navigating from entry to restroom. Older adult with cognitive load following wayfinding signage. More journeys are better; three is the floor. Each journey should be timed, documented, and reviewed by someone other than the person who designed it.
8. Document each barrier with spatial reference. Tag the location in the 3D model so the design team and the contractor can find it without ambiguity. A barrier described in prose ("near the elevator lobby") is a barrier that gets argued about. A barrier tagged at a specific coordinate in a shared model is a barrier that gets fixed.
9. Prioritize by impact, not by cost. Critical safety barriers first. Usability barriers second. Convenience improvements third. Cost-to-fix is a secondary filter, not the primary one. Inverting that order is how accessibility programs become budget-line decoration.
10. Co-review with people who have disabilities — not just consultants. Accessibility consultants are valuable. People who navigate the world with the relevant disabilities are essential, and the two groups are not interchangeable. The MapIt research notes that the scanning tools themselves are not yet fully accessible to their intended users (PMC/NIH), so build the co-review process around that limitation — pay participants for their time, accommodate their preferred review format, and treat their input as primary evidence rather than as a confirmatory check.
11. Test design solutions in the digital twin before approval. Run two or three remediation options against the model. Pick the one that performs best across your user-journey simulations, not the one that drew first or the one the architect liked most.
Phase 3: After construction
12. Re-scan to verify the fix. A post-construction scan against the pre-design baseline confirms the contractor delivered what was specified. This is the strongest accountability mechanism the technology offers, and it costs a fraction of what a punch-list dispute costs.
13. Archive the digital baseline. Future renovations, leasing decisions, and emergency planning all benefit from a current 3D model of the space. The model you commission this year is also an asset for the next decade of facility decisions.
14. Build 3D scanning into your accessibility review cycle. Annual or biannual re-scans catch furniture creep, signage drift, and accumulated minor changes that erode accessibility over time. Most occupied buildings degrade in their accessibility performance year over year, not because anyone intends to make them worse, but because no one is measuring.
15. Publish what you learned. The independent research base on accessibility outcomes from 3D-scanned design is thin. Practitioners who document their findings — what worked, what failed, what cost what — strengthen the field for everyone and accelerate the day when the workflow becomes standard rather than novel.
Inclusive design is a question asked before the first blueprint is drawn, not a feature added after occupancy. 3D scanning does not make a space accessible; the people who design with it do. The scan is the instrument that gives them the evidence to make better decisions, faster, with the people whose lives the space will shape. The checklist above is where that work starts.